I recently had a problem with an ASP.NET application on IIS where IIS would kill my Application Pool process whenever a specific query was executed. There was no warning and while I could see the process disappear from my logging tool in real-time, I didn't get any error messages or exceptions. Thus began an epic adventure of debugging rules, crash dumps, and WinDbg. It's worth noting that I really have no idea what I'm doing here. Like most modern .NET developers I gave up this sort of thing years ago in favor of the debugging available through Visual Studio and other modern tools. However, it turns out that the only way to get detailed information in cases where IIS kills your process is to do it the hard way. There's probably also multiple hard ways to do it - this is just the one that worked well for me. Hopefully this saves you some time should you ever need to follow me down the rabbit hole.
Check The Event Logs
Before you start the process of getting crash dumps, etc. it might be helpful to check out the Windows Event Log. This should give you some small indication of what's going on, or at least give you something to Google. In my case I didn't have anything in the Application log, but in the System log I found an Information message with a source of Application Popup every time my process got killed:
Application popup: w3wp.exe - System Error : A new guard page for the stack cannot be created.
I also had a Warning from the source WAS:
A process serving application pool 'MyAppPool' suffered a fatal communication error with the Windows Process Activation Service. The process id was '5288'. The data field contains the error number.
These two messages gave me enough for a search and pointed me in the right direction. In this case all signs pointed to a stack overflow, but your specific Event Log messages might indicate something different.
Enable Debugging Rules
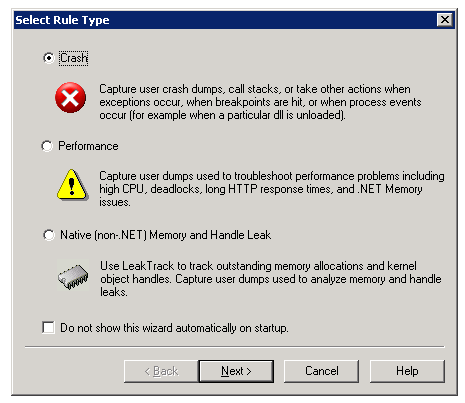
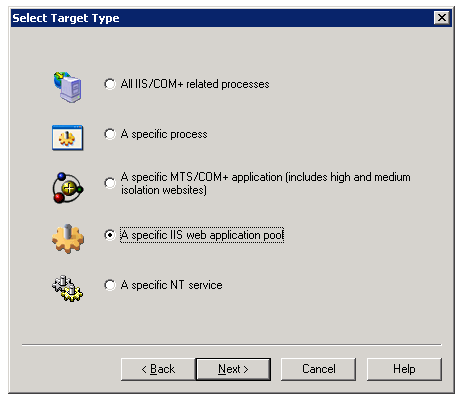
The next step is to enable debugging rules to generate crash dumps. You'll need the Debug Diagnostic Tool for this part, which can be obtained here. Once you've installed it, you'll need to restart IIS with a iisreset command from the command prompt. Then launch the Debug Diagnostic Tool and walk through the wizard for setting up debugging rules. This essentially creates watchers for various events and then takes various actions (such as dumping logs) when they occur. Specifically you want to create a crash rule:
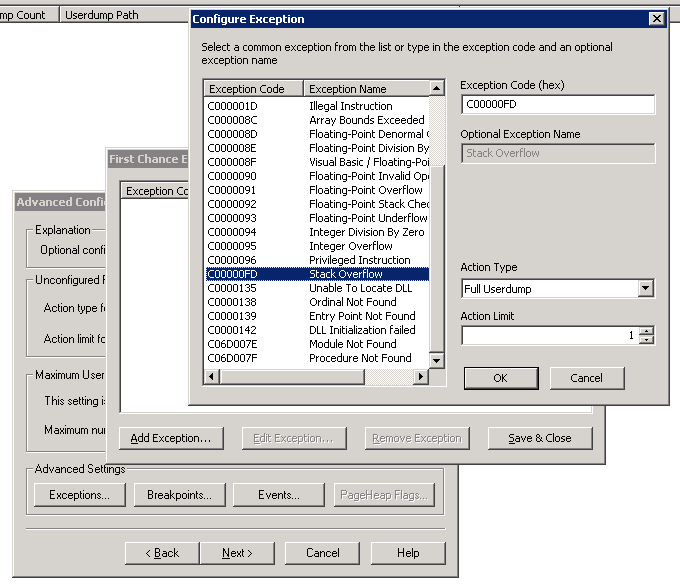
Then when you get to the Advanced Configuration page, click on Exceptions and then Add Exception. This will let you select from a list of exceptions including Stack Overflow. Also make sure to change the Action Type to Full Userdump:
Finally, select a location for the log files. Make sure it's got plenty of space because the files can get pretty big.
Open The Dump In WinDbg
Now run your application until it crashes. You should get some large .dmp files in the folder you selected during the wizard. For the next part you'll need to obtain WinDbg. It's important to get the version that matches the build profile of your application, not your system. So if your ASP.NET application is built for x86, you should get the x86 WinDbg tool even if your server is x64. [The raw installers can be obtained here](http://codemachine.com/downloads.html).
Once you install WinDbg, open it up and select Open Crash Dump from the File menu. Then you'll need to type the following two commands into the crash dump window:
.loadby sos clr
!clrstack
If everything goes well, this should print out the full stack when the process crashed (it might take a while). That should get you on your way to debugging what went wrong.
Additional Resources
In the course of trying to figure all of this out I came across some valuable resources:
- This Stack Overflow question got the ball rolling.
- This blog post gives some good information about what to do once you get the crash dump loaded in WinDbg.
- This Microsoft support page has some step-by-step instructions for configuring Debug Diagnostic Tool in different environments.
- This blog post has a good reference on the commands that are available in WinDbg.